Contributed by: Andre Carere, Strength & Conditioning GA, Springfield College
As access to technology continues to grow, and the push for schools and sports teams to find a competitive edge continues, the role of the modern-day strength and conditioning coach continues to evolve. The most recent evolution is the addition of sport science within the field of strength and conditioning. This shift has occurred so rapidly that the field of sports science is now considered its own field. But unless you're involved with an organization with a large budget, odds are that you, as the strength and conditioning coach, must fulfill the role of both coach and sports scientist on your own.
This can be an enormous task and can easily result in large amounts of time spent on data collection and reporting instead of interacting with athletes and coaches. After reading this article, I hope that you will have a guideline for ways to streamline your approach to free yourself up for doing what really matters in our profession, COACHING.
My Background
First, some context on my background and current situation so you can better understand my approach. I've had opportunities to coach and intern in almost every type of situation regarding strength and conditioning. I've spent time in the private sector, with athletes and the general population, the collegiate setting, in both Canada and the United States, as well as in multiple levels of pro sport. These experiences have allowed me to collect and implement data in various situations, from having no budget or equipment to having the best of the best regarding data collection.
Currently, I am completing the second year of my Master's in Strength and Conditioning at Springfield College while also interning in professional hockey with the Springfield Thunderbirds. My current Graduate Assistant position at Springfield College has allowed me to work with GPS data with our men's soccer team.
But enough about me, let's get to streamlining our process!

Step #1: Choose Your Equipment
First, you need to know what equipment you have available to use to collect information. In my current situation, the two most powerful tools I have are GPS (utilizing Catapult's Playertek pods), Soreness questionnaire data, and Just Jump mats. The equipment you have will largely depend on your budget or what you currently have at your facility. If you aren't sure what equipment to get for your current situation, I would highly recommend reading Intent: A Practical Approach to Applied Sports Science for Athletic Development by Justin Roethlingshoefer and Devan McConnell. This will provide you with an overview of what is possibilities exist and may be best for your data collection purposes/budget.
Step #2: Determine What Your Equipment Can Measure
This step sounds easy but is crucial in data collection. You need to know what your equipment can collect, how to properly use it, and how to analyze the data it provides accurately. This will guide you for the next step in the process.
For some context, my GPS devices can measure over 125 metrics, but that is nowhere near the amount collected by Catapult's Vector system. But still, 125 metrics is a lot! On the other hand, our Just Jump mats don't have the chip required to measure RSI, so utilizing that metric is not an option.
Step #3: Choose Your Metrics
Now that you know what you can measure, you need to decide which metrics you will look at. This is a crucial decision that will dictate the decisions that you can make by examining your data. I would suggest picking metrics that can be collected quickly and repeatedly. Finally, you need to determine which metrics are the most “coach friendly.” If the coaches don’t understand the metric, or the metric isn’t meaningful to them, then it may be a waste of time to collect and analyze it.
Returning to my example with men's soccer, our GPS collects over 125 metrics. This is, of course, way too much information for me to constantly look at, but it provides me with a starting list. Next, I need to decide what is easily collected and repeatable. Most of these metrics collect automatically, making them easy to collect. However, not all of these metrics are valuable to guide my decision-making process. When first making my decision on this matter, my initial list included metrics such as:
- Total Distance
- Distance per minute
- Player load
- Player load per min
- Total sprint distance
- Distance covered in Speed Zone 5
- Total number of sprints
- Total number of decelerations
- Total number of accelerations
- Time spent in Speed Zone 5
Now that I had a small list, I needed to determine which of these metrics would be valuable for me to know and simple enough to provide context to our coach to make decisions. Our coach had a year of GPS use under his belt with our previous Graduate Assistant. This gave him prior knowledge on two of the above metrics: Total Distance and Distance per min. Because he already understood these two metrics and because they measured both volume (Total Distance) and intensity (Distance per min), it made sense for these to be our major metrics of interest.
In addition to those metrics, I also wanted to examine our sprint data. Because of that, the other metrics I picked out were total sprint distance (this is any distance covered at 75% or higher of our athlete's max recorded speed, this is used as our "Gamespeed Volume") and Distance covered in Speed Zone 5 (this is any distance covered at 90% or higher of our athlete's max recorded speed, this is a true max velocity metric making it our "Gamespeed Intensity" metric).
Step #4: Determine How to View Data
This decision will bleed into the following steps and is a crucial one. How you visualize the data will determine how easy it is to understand, analyze, and utilize. My suggestion is to use software that you know how to use or can quickly learn. In addition, the software needs to be easily accessible.
For me, this meant using Google Sheets. This is a free tool in Google Drive that is extremely powerful. It allows us to use much of the data collecting power of Excel, with the ability to access the information quickly. In the previous year, our men's soccer Graduate Assistant used Excel for housing our data. Although it is more powerful than Sheets, it meant the data was only housed on his computer. Because of this, he had to send the information to our coach daily. I opted to change to Google Sheets so that multiple people could access the data, including the coach, at any point.
Step #5: Create Easy to Understand Visuals
This step sounds simple in practice but is easily the most complex and time-consuming step of them all. Although there is a lot of initial work in the backend, putting the time and work in will free up a ton of time when you want to utilize the data consistently. How you do this will be highly dictated by the software you decide to use. I will provide information below that will work for Excel and Google Sheets.
Since I decided to use Google Sheets and didn't know much about using many of the formulas available, I utilized YouTube to teach me what I needed to know. The two accounts I found most helpful, and that I highly recommend you check out for your own needs, are: DSMStrength and Adam Virgile (Links to both included below)
These two accounts have numerous videos explaining how to use Excel and Google Sheets to create valuable visuals for your data. Go onto the sites and do some digging to determine what will work best for the data and information you want to display. I highly recommend looking into their videos on "Dashboards."
Some examples of the visual's I've created for Men's Soccer and our GPS data, along with Men's and Women's Volleyball using Just Jump mat data, are included below:
Figure 1: Men’s Soccer Team GPS Dashboard
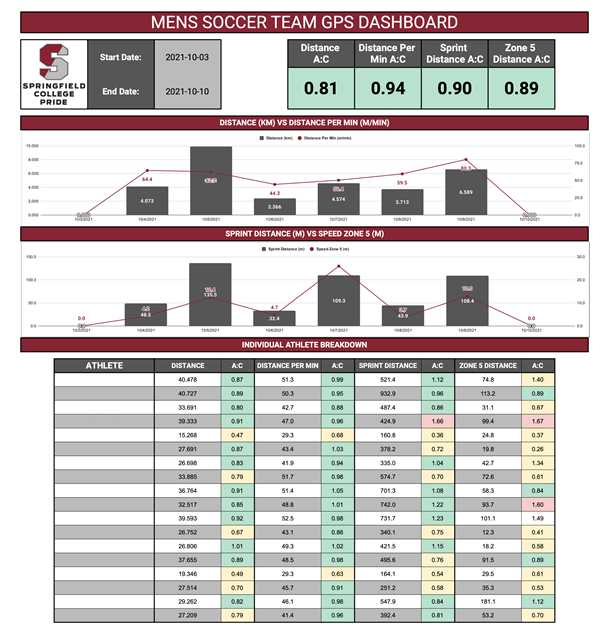
Figure 2: Men’s Soccer GPS Individual Dashboard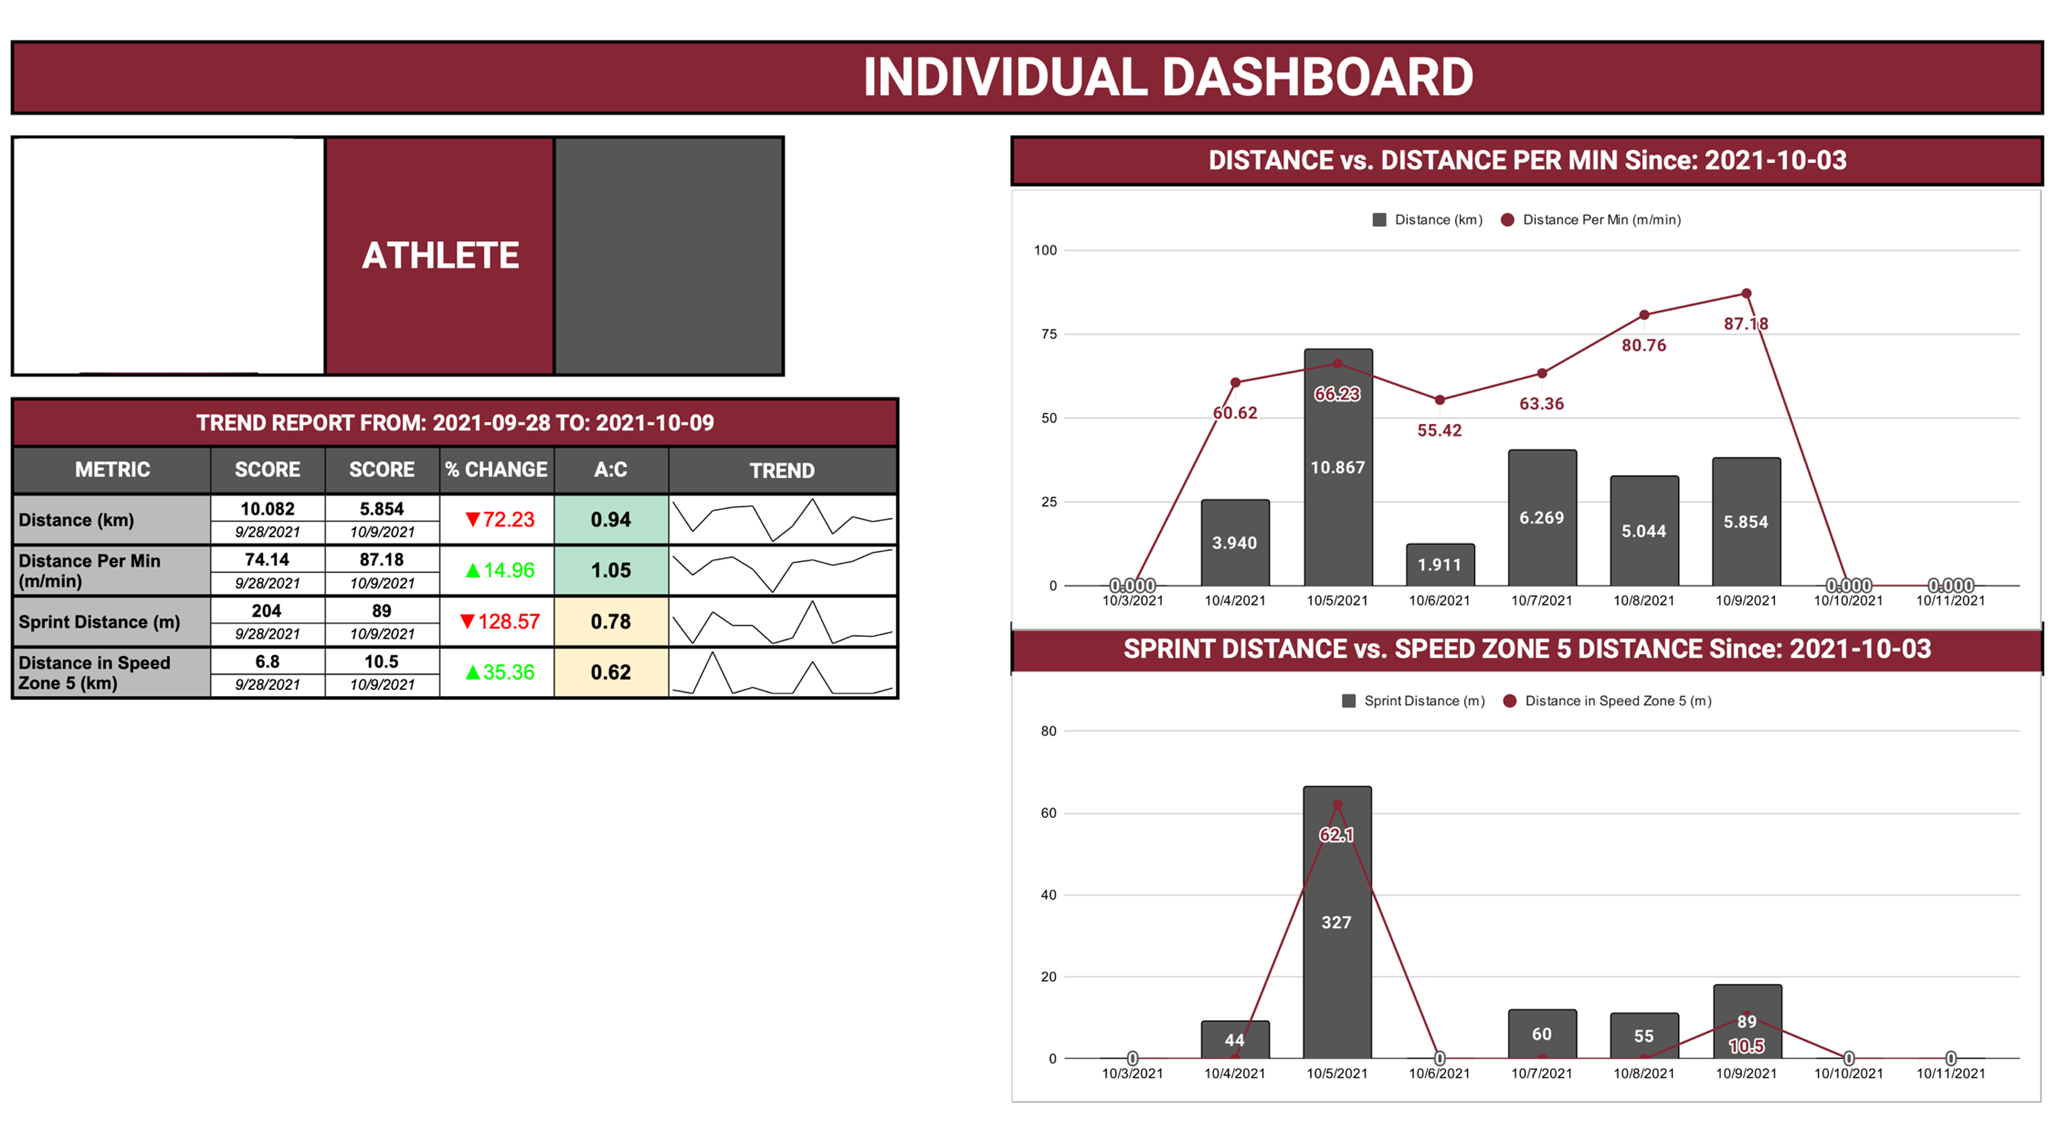
Figure 3: Women’s Volleyball Jump Height Monitoring Dashboard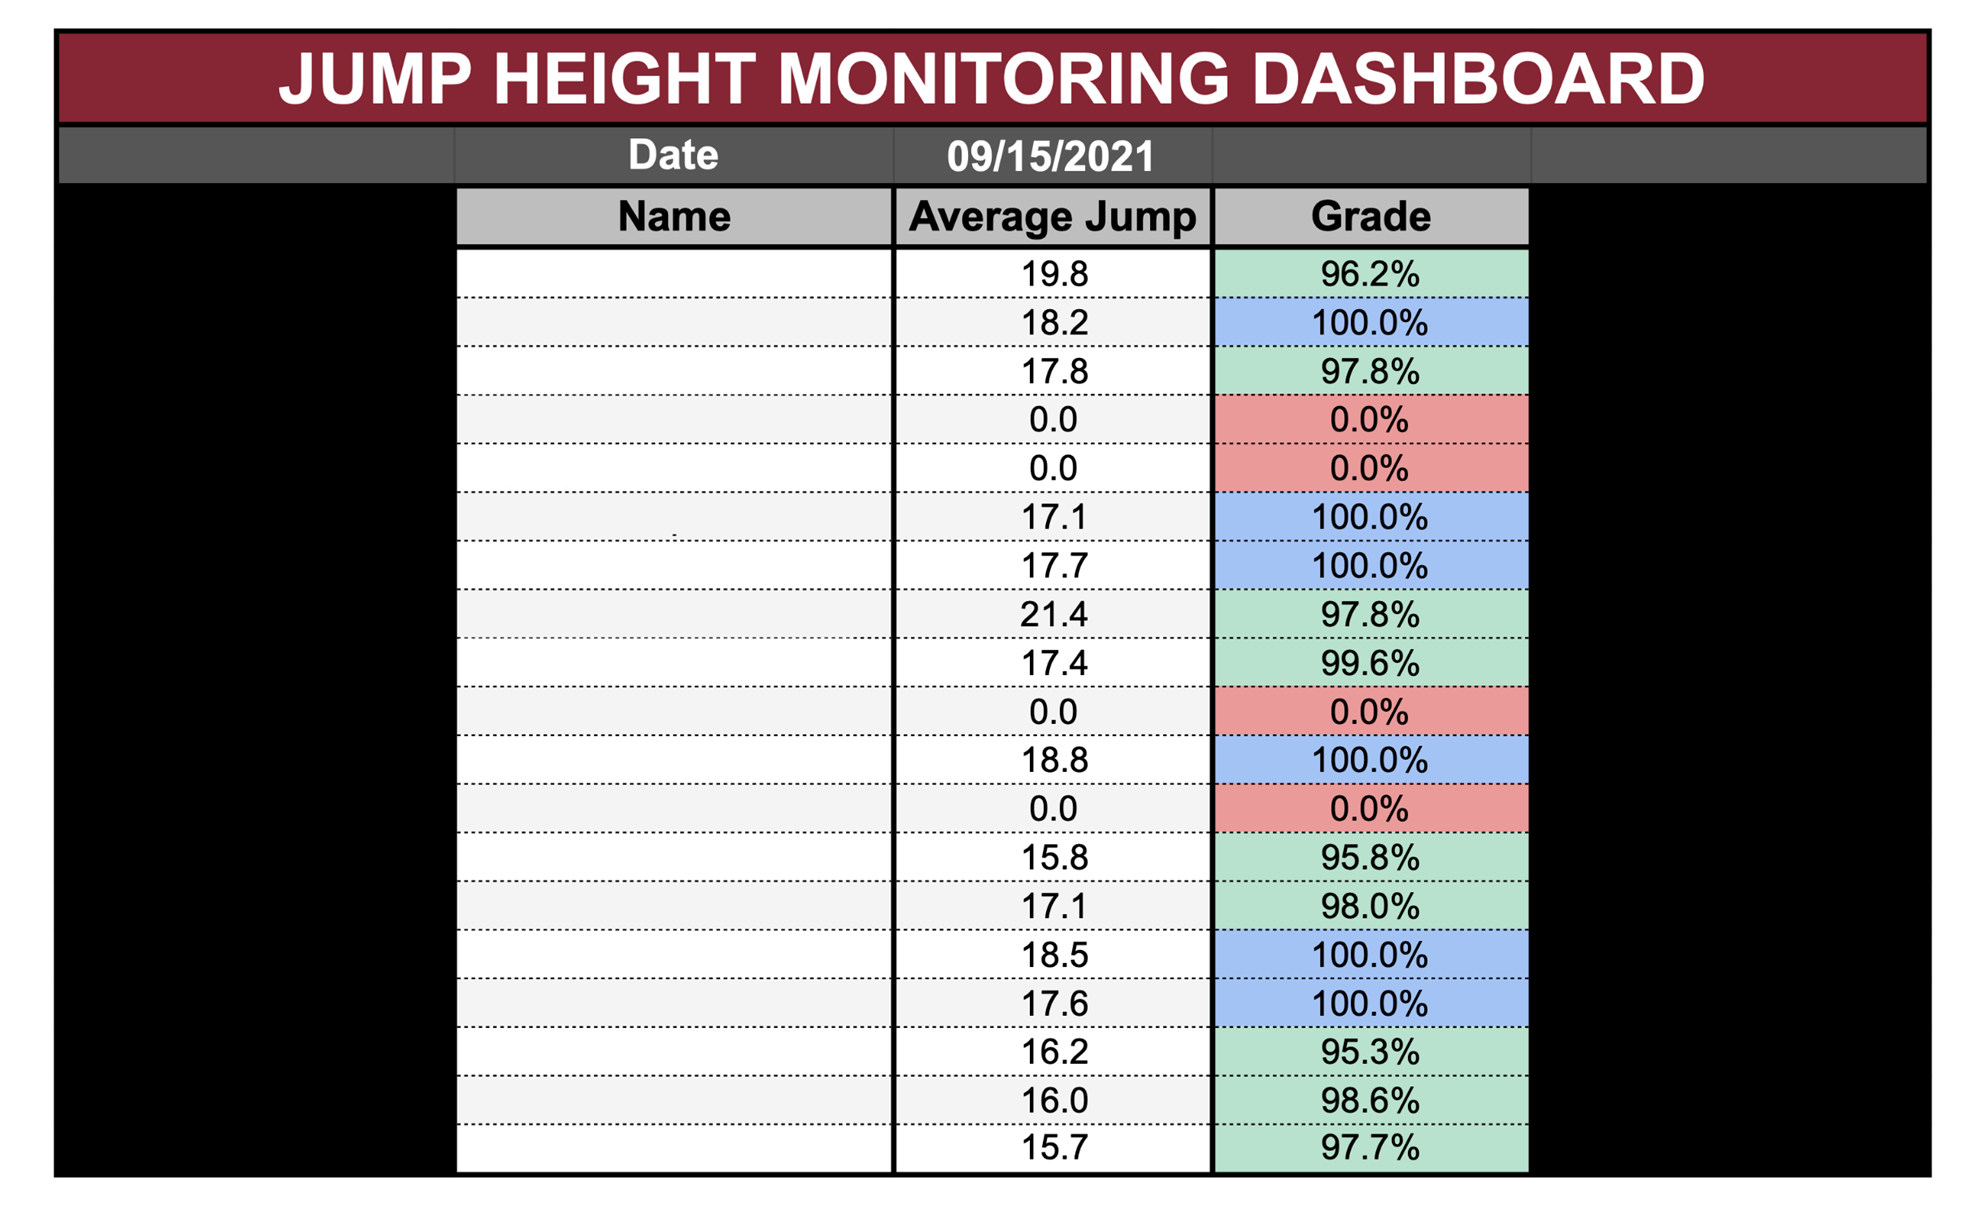
Figure 4: Women’s Volleyball Jump Height Team Average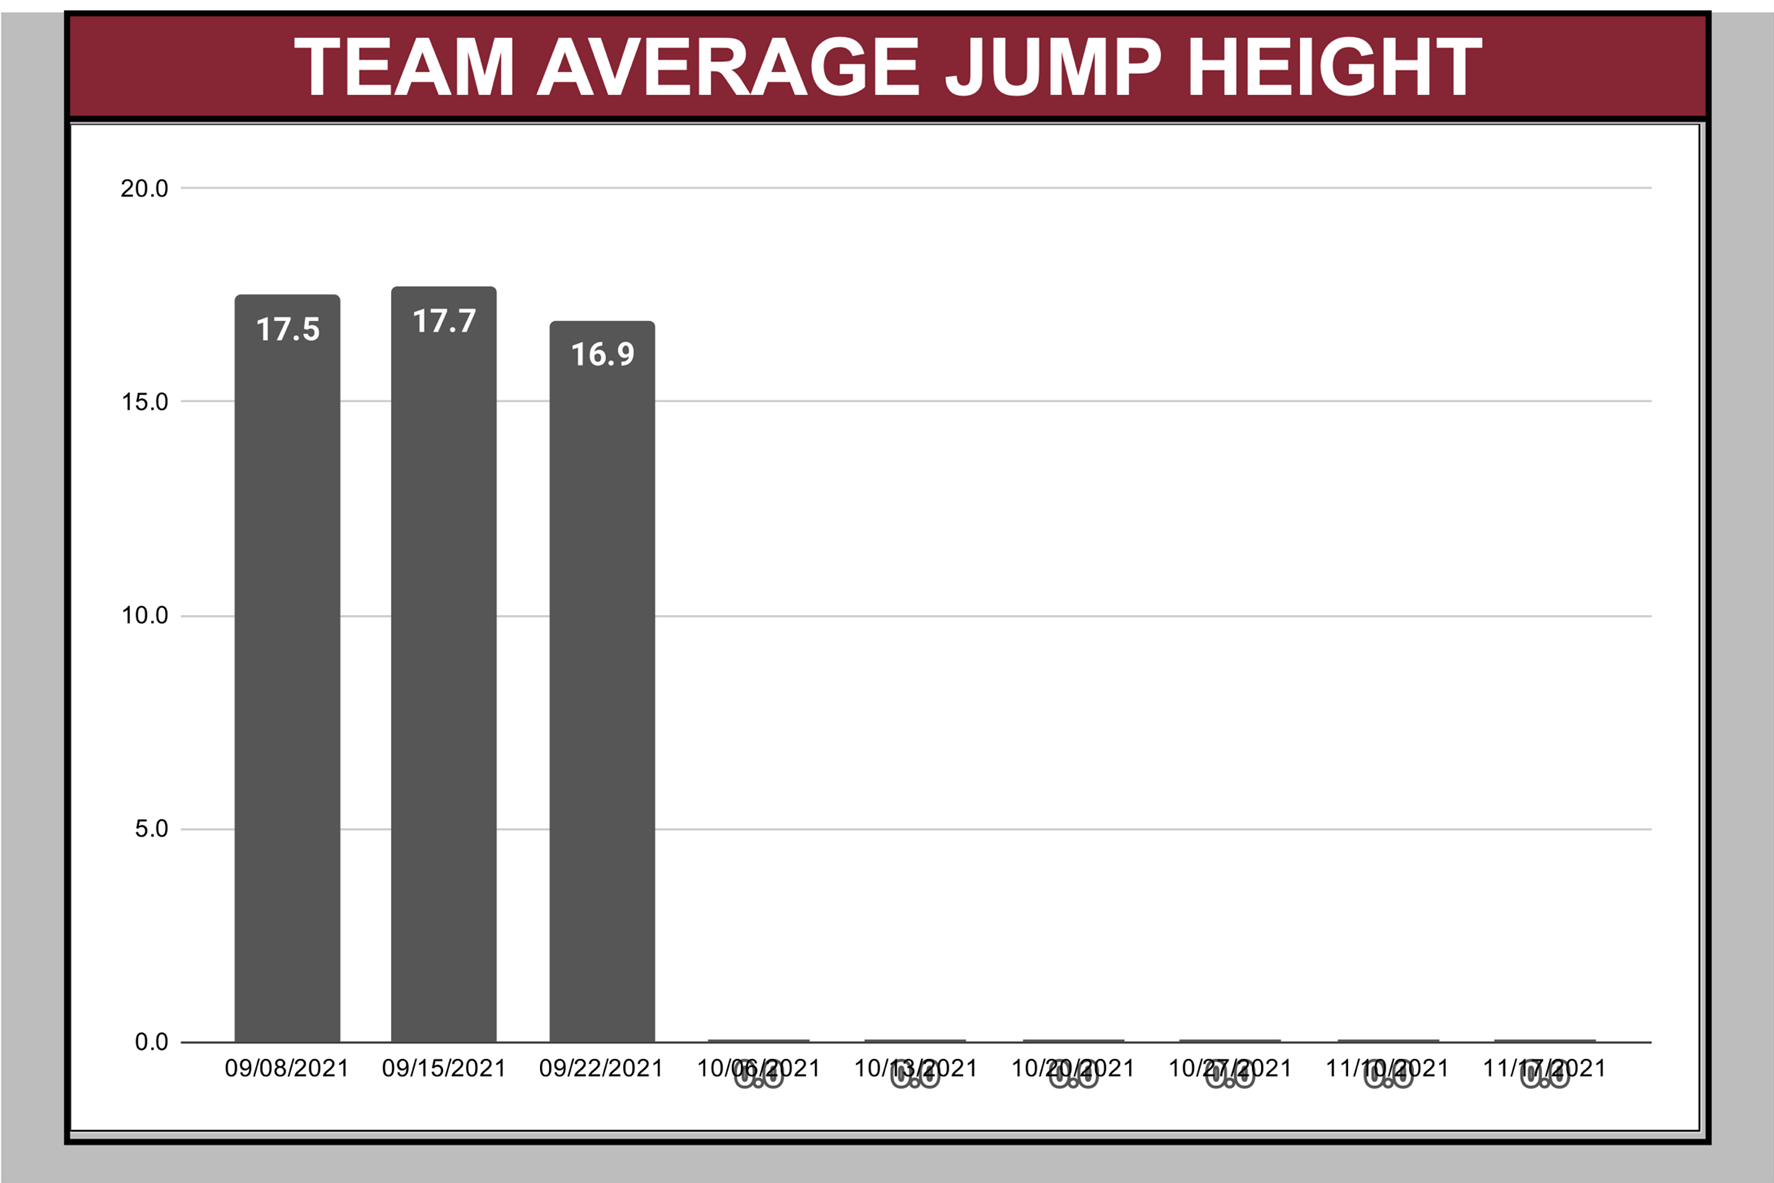
Figure 5: Women’s Volleyball Jump Height Individual Overview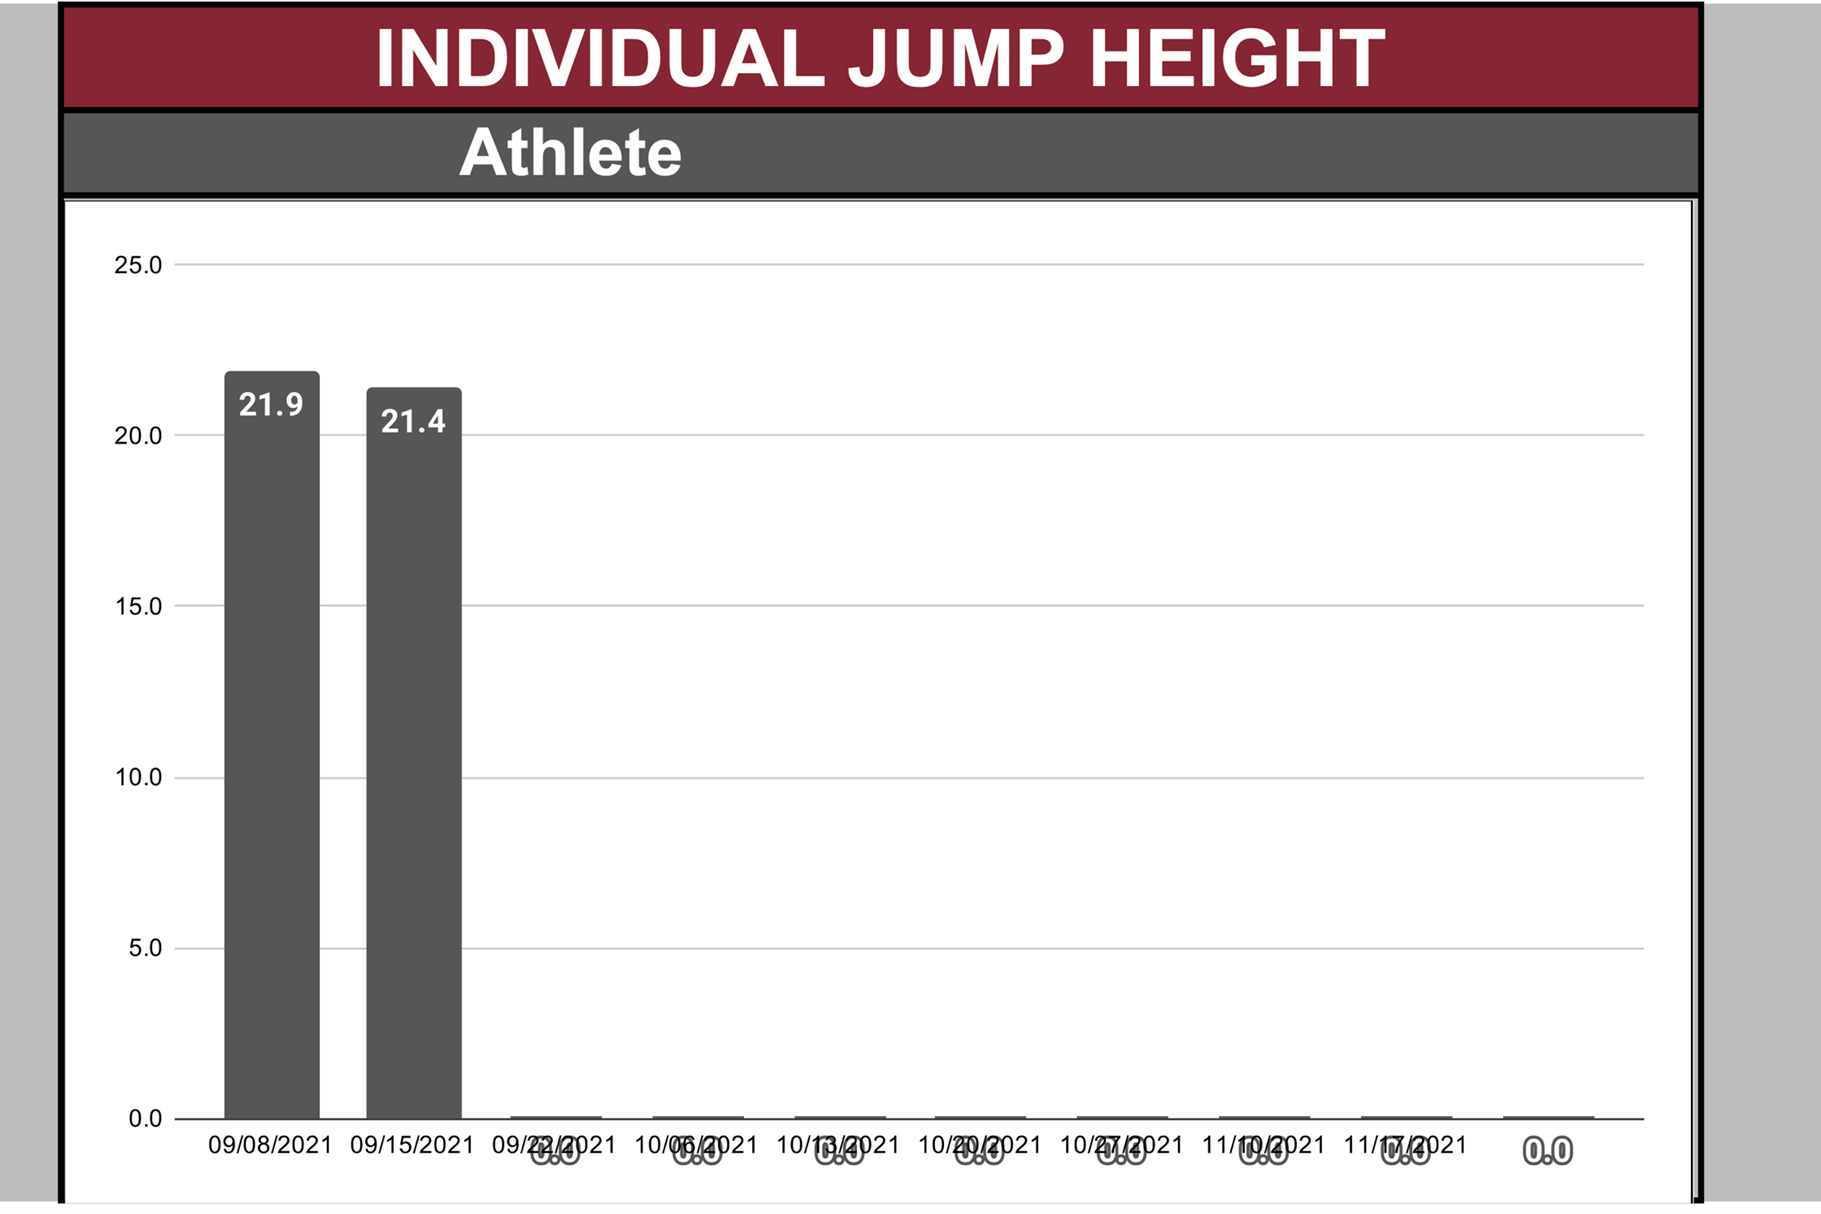
Step #6: Create Easy to Understand Definitions for Metrics
Now that your data is visibly appealing, you need to define the metrics for yourself, your staff, and your coach. I highly recommend making these definitions utilizing your coach's vocabulary so the coach can better understand the definitions. Examples of how I did this with our soccer metrics are below:
- Distance (km): total Distance covered
Overall Volume Metric: tells us the total amount of work for the session. Higher # = Higher amount of stress - Distance Per Min (m/min): total distance covered / duration of practice
Overall Intensity Metric: tells us the pace of the session. Was it up-tempo or a slower, more technical session. Higher # = Higher pace - Sprint Distance (m): total Distance covered at 75% of max speed and higher
Game Speed Volume Metric: tells us the total amount of work performed at game speed for the session. Higher # = Higher amount of stress - Speed Zone 5 Distance (m): total Distance covered at 90% of max speed and higher
Game Speed Intensity Metric: tells us the total amount of work performed at MAX SPEED. Higher # = Higher amount of stress at full intensity
I have written these definitions on a Word document that is shared with the coach so that he can access the definitions when looking at the data. I also printed it off and posted it in our locker room. Ensuring our athletes and coach understanding of each each metric leads to valuable conversations surrounding practices and games. This guarantees everyone is on the same page when discussing metrics.
Step #7: Define The Process
Now that everything is easy to share, visualize, and understand, we need to decide how to collect and interpret the data continually. Although this is tedious, I HIGHLY recommend not skipping this step. This will allow you to have an easily repeatable process and have other people step in to assist quickly. Create a document where you outline the entire process, from collecting the data, putting it into your visuals, sharing it with the coach, and making decisions based on the data.
By defining your process, you can train others on the process so that they can be involved. I needed to do this in my current situation to ensure everyone within our strength staff knew how to collect and use our GPS data since I am unable to be at every practice. This allows me to send staff members out to each practice that I cannot be at, and I know that everything will be collected and appropriately interpreted so the coach can access information rapidly.
Conclusion: The Seven Steps
- Choose your equipment
- Determine what your equipment can measure
- Choose your metrics
- Determine how you'll view the data
- Create an easy to understand visual
- Create easy to understand definitions of your metrics
- Define your process
Overall, the role of a strength and conditioning coach/sport scientist is not easy and can be very time-consuming. I hope that if you follow the seven steps above, you can significantly reduce the amount of time you spend interpreting data on a day-to-day basis. Following this process will certainly take time on the backend and require a lot of additional work. But, if you can do this during the off-season or during a down period, it will drastically decrease your workload when you start tracking with GPS.
The streamlining process is a process in itself, but it does provide many benefits that aren't just time related. It allows you and your sport coach to get on the same page, resulting in more effective conversations and an ability to take actions and provide recommendations that benefit your athletes. It allows the strength staff to all be on the same page with information and be able to step in and assist other staff members in data collection at a moment's notice. It provides valuable leadership experience that can directly apply to Head or Director positions in the future. Lastly, it provides you with a background in creating and interpreting data, a new skill set that you can use as a coach in the future.

Athletics, Inc.? : The Paradigm Shift in Strength and Conditioning
From the GA's Desk: 3 Keys to Successfully Implement GPS Tracking