Written By Mikey Blazejowski
Within my short career as a strength coach, I have always had a passion and love for the hard data of sports science and, more specifically, GPS units. Because of load monitoring equipment, such as GPS units, we can quantify the stress placed on our athletes on the field and suggest changes to our sports coaches based upon data.
Before diving into my tips for implementing a GPS system for the first time, I believe it is important that you understand my background as it relates to the use of GPS. I’m fortunate to have had the opportunity to work under various well-known and respected strength and conditioning coaches over the past few years. I’ve been able to learn important lessons throughout these experiences that have prepared me to implement and monitor a GPS system independently.
My first experience with practical GPS work came during my internship under Tyler Clarke at Vanderbilt University. At this internship, I began to learn the daily management and workflow of running a GPS system. In addition, I began to understand the various metrics that should be tracked to represent the stress placed physically on the body during a game, practice, or training session. The biggest takeaway from this experience was just getting my hands dirty in the GPS game for the first time seeing how reports are created and what each metric meant to the session.
I was again exposed to GPS under Ben Schumacher at the University of Minnesota. Like Vanderbilt, I helped Coach Schumacher with the daily management of their GPS system and continued to learn about GPS metrics and how Minnesota uses the data. The biggest takeaway from this experience was how to best communicate the data to sport coaches by putting it in their terms and percentage of a game. In addition, this taught me how to sift through all the B.S. of all the metrics being tracked and find what is truly meaningful.
My final experience as an intern with GPS before running my own system was this summer at the University of Tennessee under Rhett Brooks. I was very fortunate to have close to complete autonomy of running their GPS system this summer. Running and managing 72 units this summer made it very easy to roll right into running 22 units at Springfield College!
Current role with GPS
Now that you know a little bit about my background, let me explain how and why we are using GPS units at Springfield College. I’m in the second year of my graduate degree and in the process of collecting data for my thesis which will be quantifying the demands of triple option football via GPS units. This idea started as a sophomore at Springfield, knowing I wanted to stay for my masters and find a way to get Catapult into Springfield College.
We currently have 22 units that we are using for football and I’m in charge of the day-to-day management of the units, data management, and report creating for our coaches. Day-to-day management can be tricky with the GA life, and I can’t thank my two GPS assistants (Andrew Papirio and Hunter Reeser) for the help they give me.
We plan to use the GPS units with the women’s lacrosse team on campus this spring. Currently, football has priority over the units, but we have been able to use them on the women’s lacrosse players during fall ball practices when the football team is off. In the spring, this will be the opposite. Women’s lacrosse will take priority over the units with the hope that we will be able to place them on the football team during some spring ball practices when the lacrosse players are not using them. Sharing units between two teams is a challenge, but well worth the possible insights that we will gain!
3 Keys to Starting a GPS System for the First Time
1. Choose Your Metrics Wisely
There are two major variables to consider when choosing your metrics.
- Which metrics make sense based upon the situation you are in (ex. Sport, how new the GPS system is, etc.)
- Which metrics will make the most sense to the sport coach
To create meaningful change, you must help the sport coaches understand the data. Although, we, as sport performance coaches typically understand most GPS metrics; this is not the case for most sport coaches. Choosing metrics that make sense to the sports coaches and are valuable to the sport coaches makes it easier for practitioners to drive change.
A general rule of thumb to follow when chooses metrics is to choose metrics that answer these 3 questions:
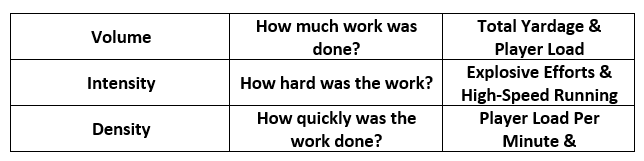
Using our Springfield College football team, we are currently tracking six metrics for research purposes and finding out what metrics correlate best to quantify the performance of a session and make sense to both our situation and sports coaches. Our 2 Volume metrics are total yardage greater than 3 MPH and Player Load. Player Load is Catapult's own metric that takes the sums of all acceleration and plugs it into an equation. The reason why we track distances greater than 3 MPH is to create more signal with our data and cut out the noise. Greater than 3 MPH is typically a jogging pace, and we can cut out all the “bad” that gets mixed into the total yardage count and doesn’t accurately reflect the stress our athletes were under.
Our intensity metrics are high-speed running and explosive efforts. High-speed running for us is any distance covered greater than 70% of the player’s top speed. Our speed zones are individually set for each player and any time a player hits a new top speed we will update the speed zones. We chose 70% for our high-speed running threshold based on Charlie Francis intensity zones in the high low model. Explosive efforts for us are the sum of accelerations and decelerations greater than 3 m/s2. This allows us to see how explosive the session was on the body.
Our Density metric is Player Load per minute, this is simply the total player load divided by the total duration of the session. The higher this number, the more metabolically demanding the session is on the athlete.
The final metric that we track is max speed. This is easily our players' favorite metric that we track and drives competition in our athletes! One big thing we use this metric for is to monitor neurological fatigue in our athletes and to see if outputs are constantly dropping from week to week.
2. Determine How to Report Data
Once your metrics are chosen, it’s time to figure out how to report the metrics. Depending on the GPS system, reports can be generated automatically within the GPS software where the data is stored. Most systems have pre-generated reports that display the data in graph and or table form.
Some systems don’t display the data the most optimal way for your situation and may require you to create your own dashboard, databases, and or reports to analyze and store the data. This can be done by downloading the raw data into an excel file from the GPS system. When creating the reports on your own, choosing how to present the data is crucial. Graphs and conditionally formatted tables (color-coded based on certain values that trigger the cell to be highlighted) in excel go a long way toward making the finished product easy to digest. Putting the data in a way that makes sense to both you and sports coaches makes life easier for critical conversations to be had and ultimately, for change to be made.
At Springfield, we have a GPS database/dashboard in excel which stores and automatically generates our reports. The reports generated in the excel workbook allow us to view multiple areas of interest:
- Daily insights to sessions and graphs
- Weekly overviews from our data to see how our week looks physically on our athletes
- Running average of positional demands for each practice type/day and game.
Below are a few sample reports from the database.
The first report, seen below, is our coaches' report. At the end of preseason, I presented to the staff my ideas on practice planning to be at our best on game day. The metrics I focused on during the presentation and will continue to focus on throughout the season are total yardage, high-speed running, and explosive efforts. When examining these metrics, I display the % of the game load. This is calculated by taking the game average for that positional group and dividing by what that player did that day for that session.
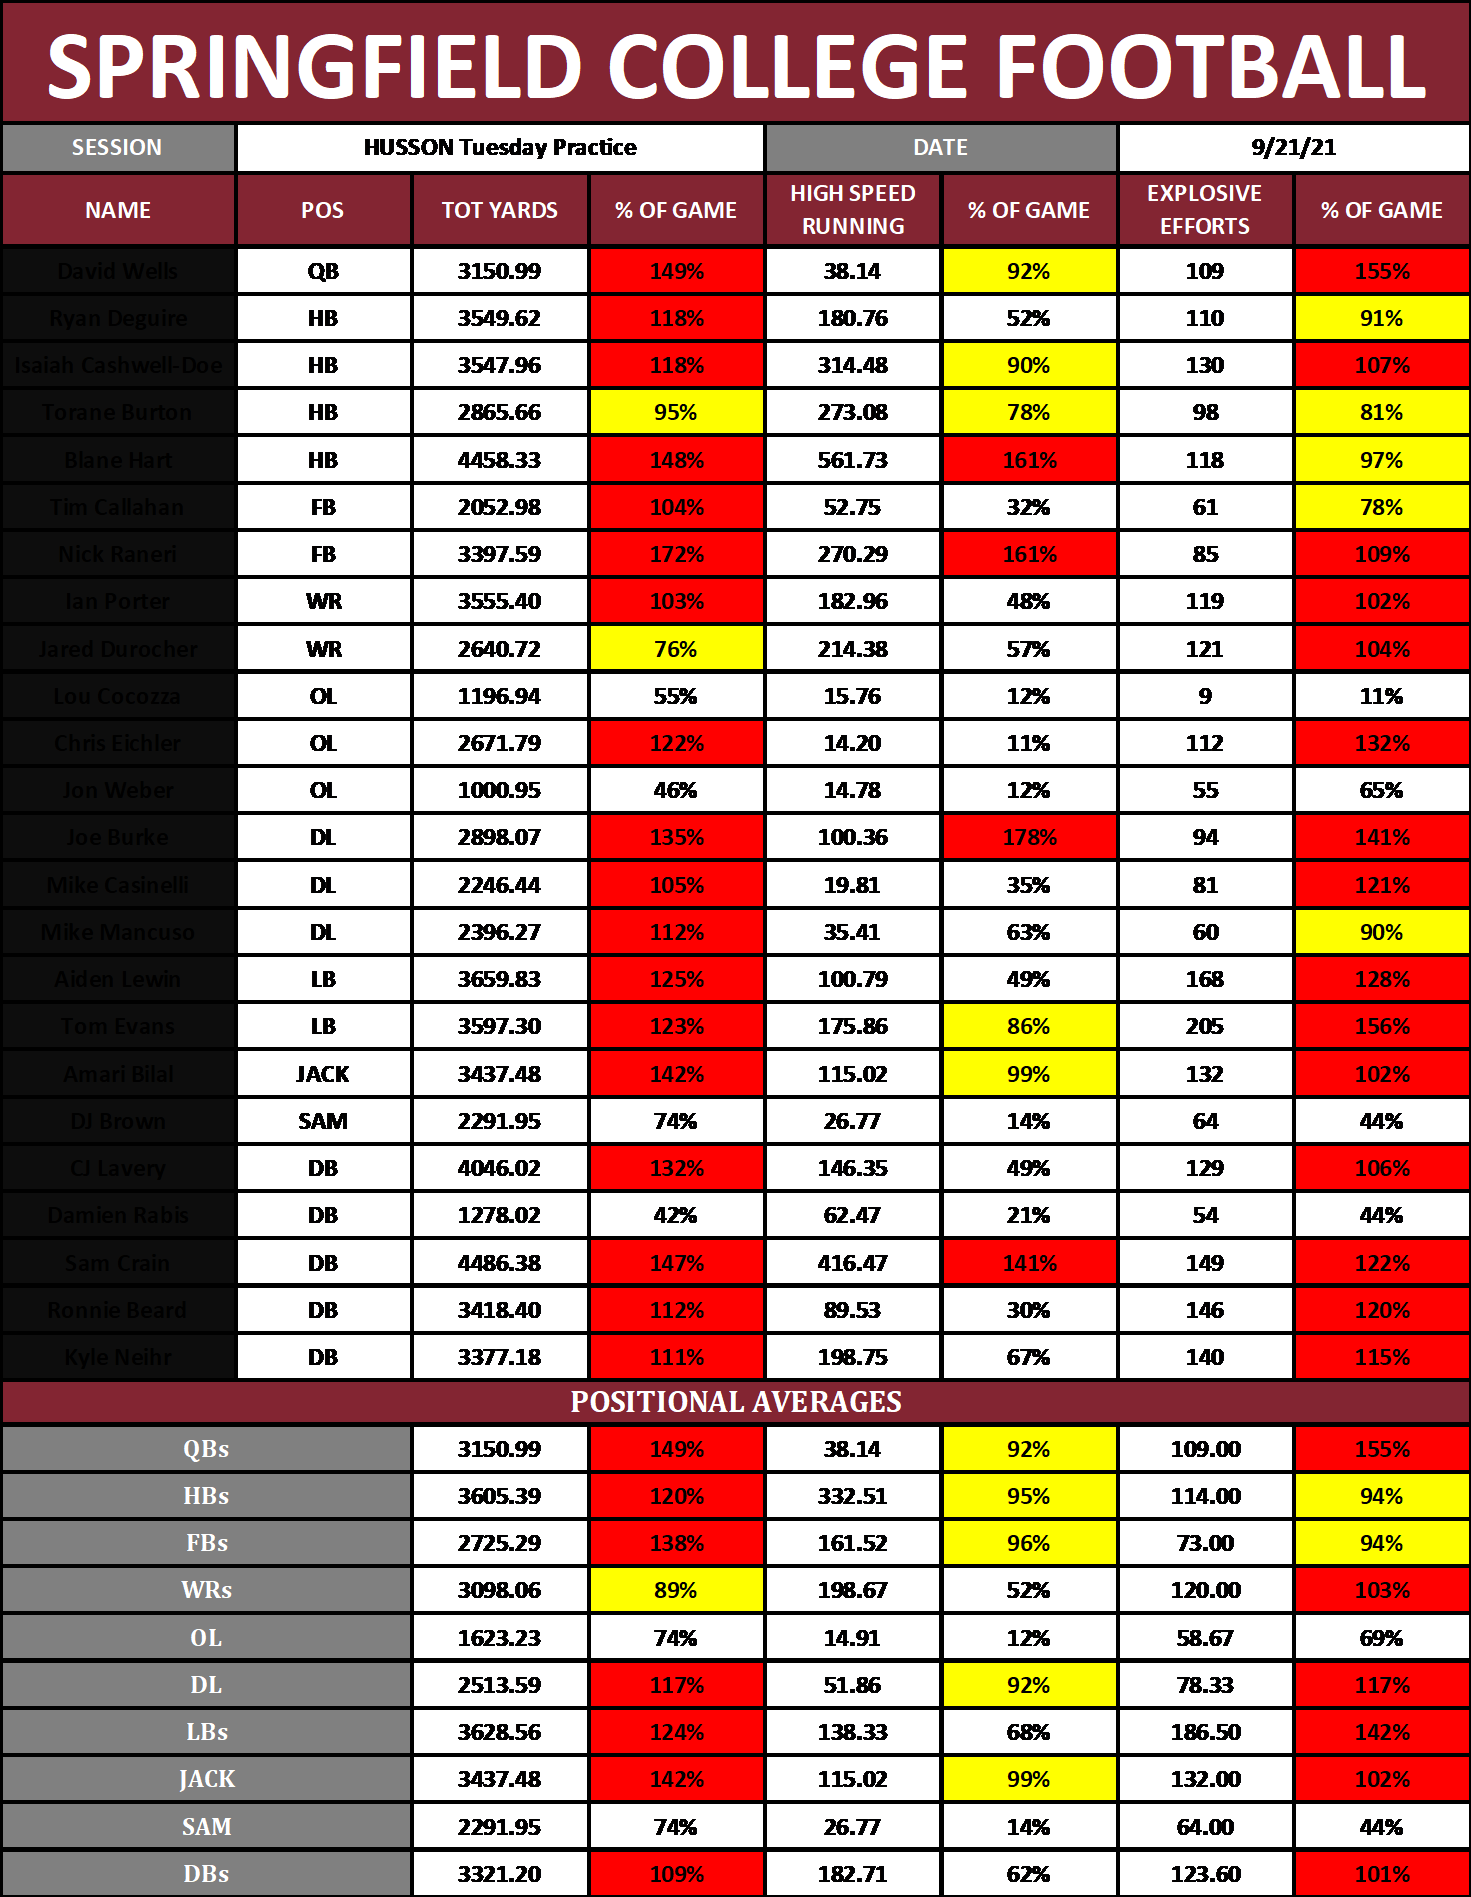
We also reported to the coaches what that positional group overall looked like for that day. We only have GPS units on the top 22 players, so there is an assumption that other players in each position group are stressed similarly. The reason why we use % of a game to display the data to the coaches is that it's easily understandable to them. Anything above 100% means the athlete played a game plus on their body during practice. Generally, coaches think the game is the hardest session for their athletes, other than preseason camp. When coaches see they are putting games plus on their athletes, it opens the door for them to question “are we doing too much”. This works effectively if they see it in game terms as college athletics are driven by results. How I put it to our sport coach is “if we are trying to recover from a game played a few days ago, why are we nearly putting double that on an athlete 4 days out from a game and giving them minimal time to recover before the play again?”. Questions like these supported by data allow for a more open dialogue about proper practice planning.
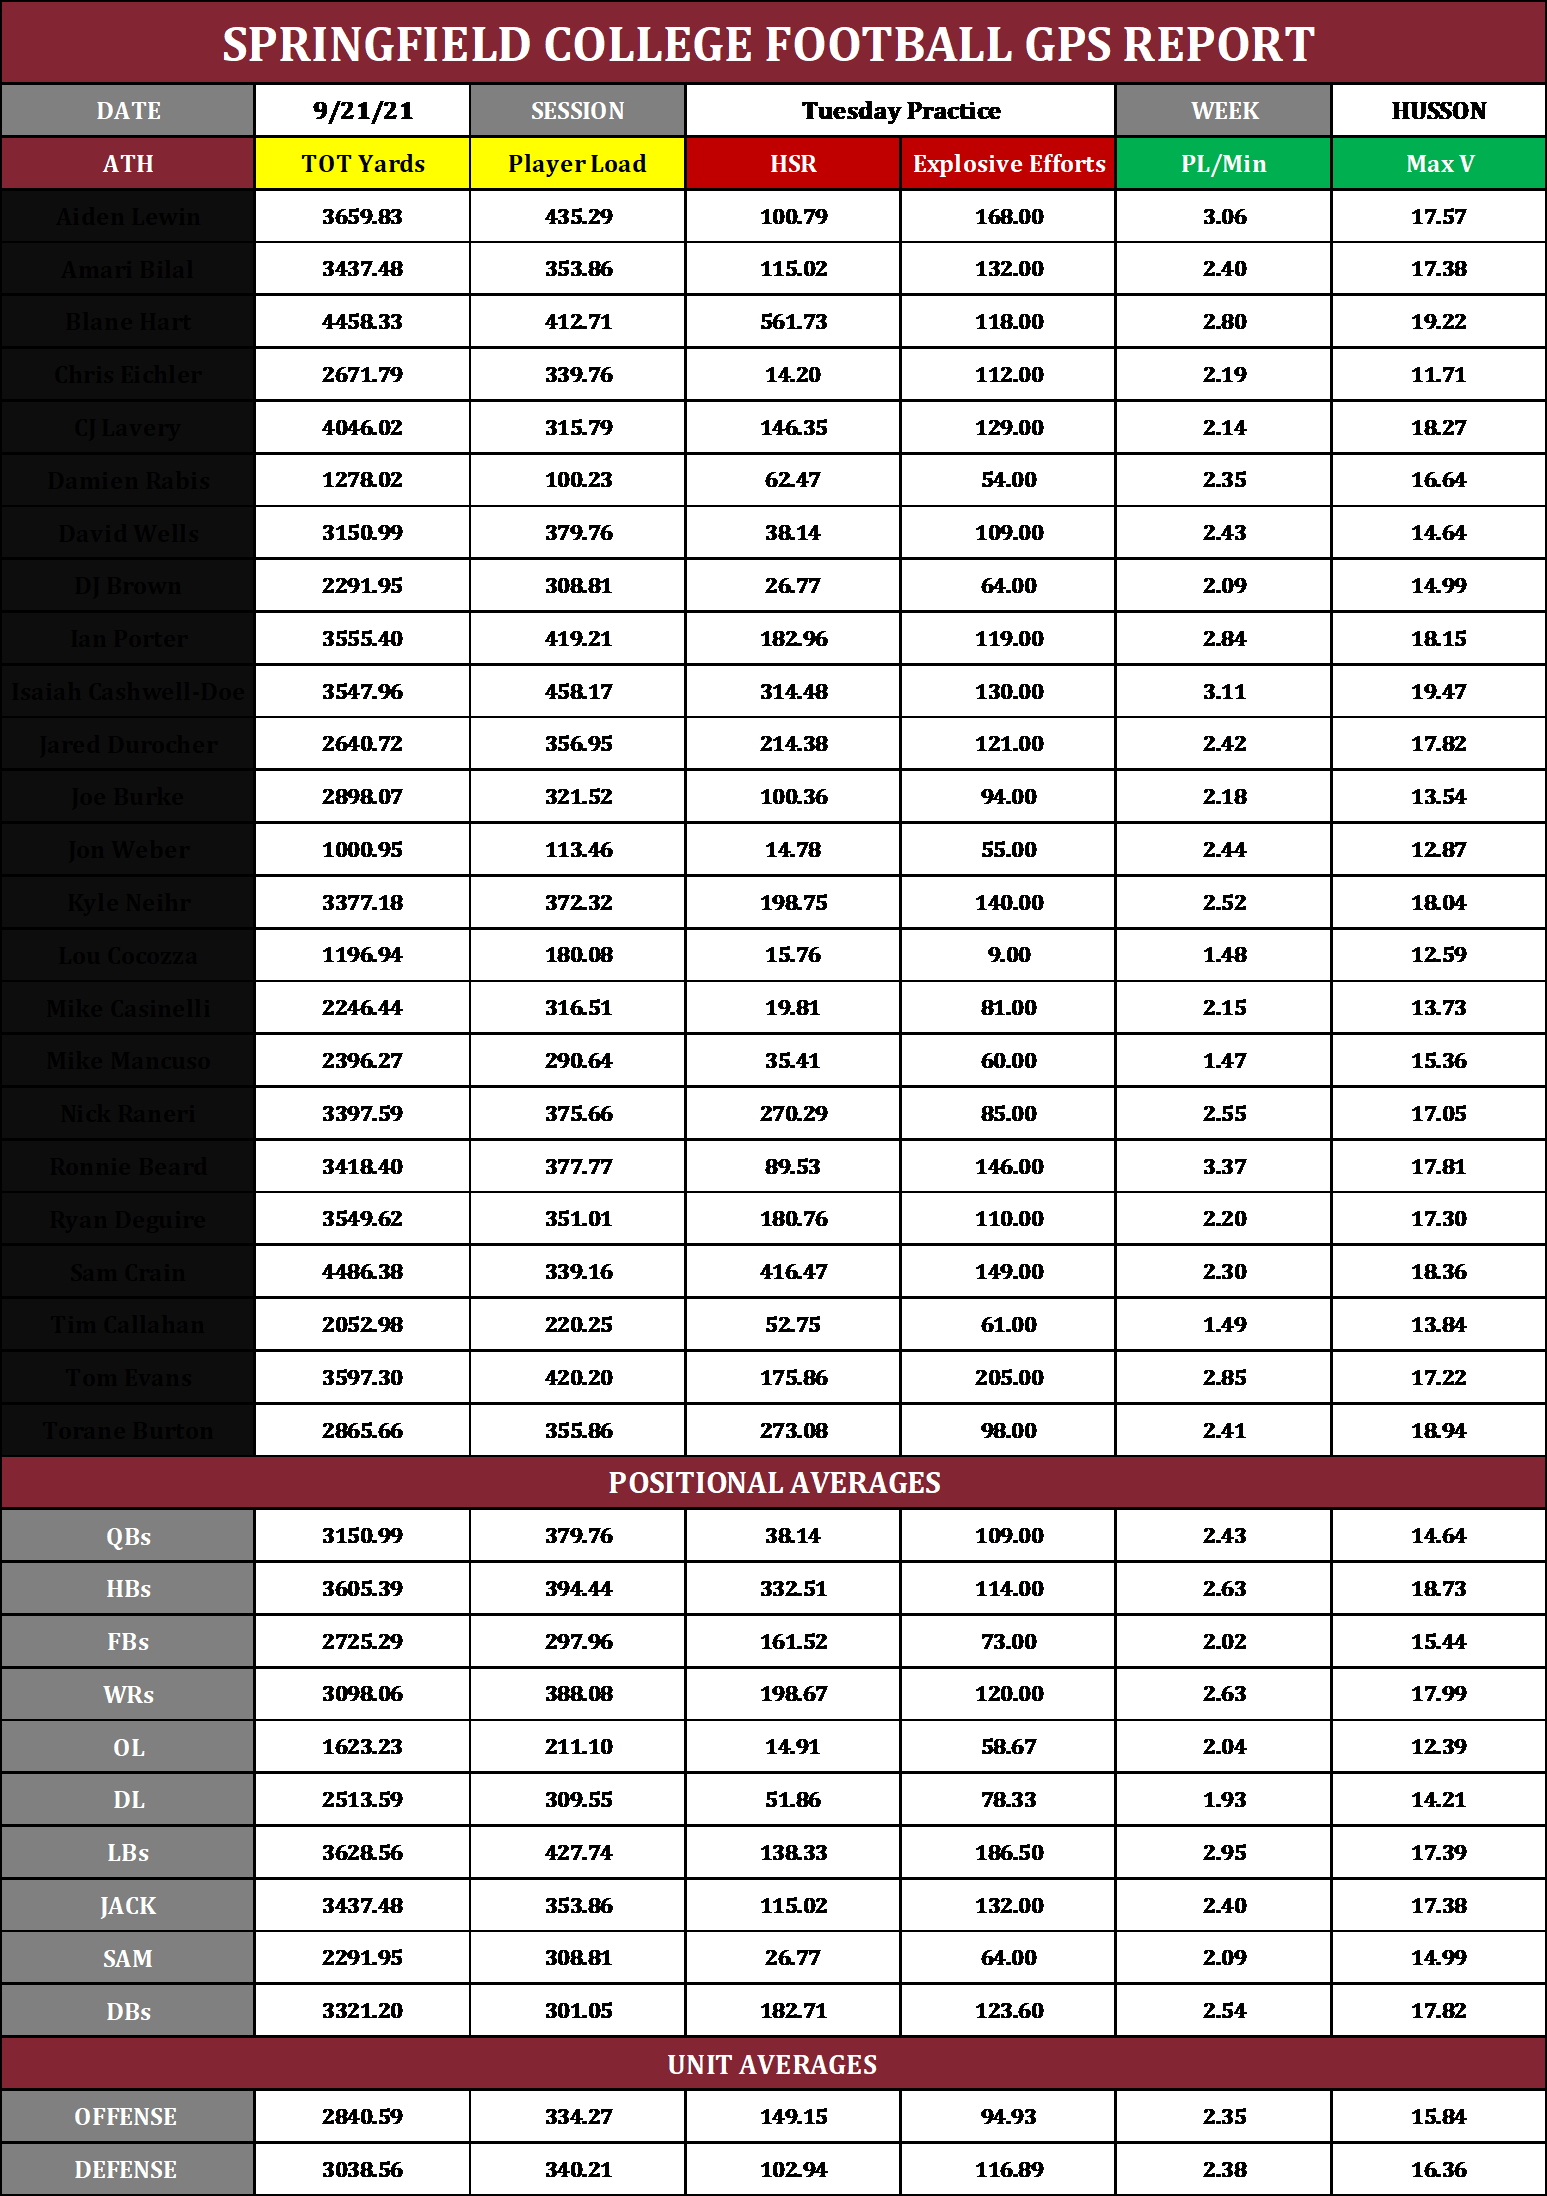
The second report, seen below, is the report we look at as a sports performance staff. Here we can see all six metrics we are tracking to gauge the demands of practice. We look at each player individually, each positional average, and each unit average to help us gain insight. This helps us monitor our athletes within training sessions to know when to pull back or modify in the weight room or inform coaches they need to pull back if needed with certain players. Another option, when pulling the athlete away from practice is not feasible, is to add more recovery modalities to our players who are excessively stressed during practice. By making reports simple and easy for you and coaches to understand, changes can be made easier based on the insights.
3. Purposefully Use The Data
Collecting data for the sake of just collecting data is a waste of time. Having a strong why supporting your data collection and a plan to use the data will save you from wasting time.
There are many ways to use the GPS data. These include, but are not limited to:
- Practice planning
- Return to play with injured athletes
- Base weekly offseason training sessions volumes off practice and game data
At Springfield, we are currently collecting the data for two of these three reasons. The first is to help the sport coaches as they play practice to ensure that our athletes are as fresh as possible for game day. The second reason we are collecting data is so that we can plan off-season training to prepare the athletes for next season.
In terms of practice planning, we are examining what percentage of game metrics the athletes are being exposed to in practice. This can help inform the coaches if the athletes are hitting metrics above what they are exposed to during a game and/or if they are not being exposed to certain metrics enough during practice.
Using the data from the season, we will examine the physical stress of a preseason practice to determine how to prepare our athletes for these demands. We do not want the first time the athletes experience these training loads to occur during practice. Slowly building up throughout the winter and the summer, our athletes will touch practice like volumes and intensities via our conditioning modalities to help them prepare. By doing this, we are exposing the athletes to the demands that they will face in their sport which should help reduce the risk of injury. Loads in summer conditioning may exceed the typical practice average to help create a reserve for the athlete, so practice is less demanding on them.
Take-Home Points:
- Pick valuable and easy to understand metrics
- Have a plan, and a why for those metrics
- Present the data in an easily understandable manager so that way meaningful change can occur!
- GPS is nothing more than another tool in our toolbox as sport performance coaches to help drive performance; use accordingly!
Final Words:
I would like to give a few shoutouts and thank you’s to a few of my mentors. First up is Dr. Mary Kate Feit for making this possible. Dr. Feit was instrumental in allowing me to write this article and making everything possible at Springfield with our GPS system. If it weren’t for her, my thesis would have never happened, and the growth as a sports performance coach of implementing GPS data and other sports science modalities would have been minimal.
If you work at a college with an exercise science program, I recommend connecting to the academic department to see if there is a way you can work together to bring more technology and services onto campus that will both serve the athletes as well as assist the academics with research.
The next two people I want to shout out and thank are Ben Schumacher and Tyler Clarke. These two men have heavily influenced my role as a sports science practitioner by teaching me how to run, manage and implement a GPS system within a team sports setting. If you don’t have a mentor in this realm, go find one.
We must work together to advance this field, and this happens through internships, mentorships, and collaborative work.

From the GA's Desk: 7 Steps to Streamlining Data Collection

Is Your Fancy Tech Even Worth It?